
Journey Map
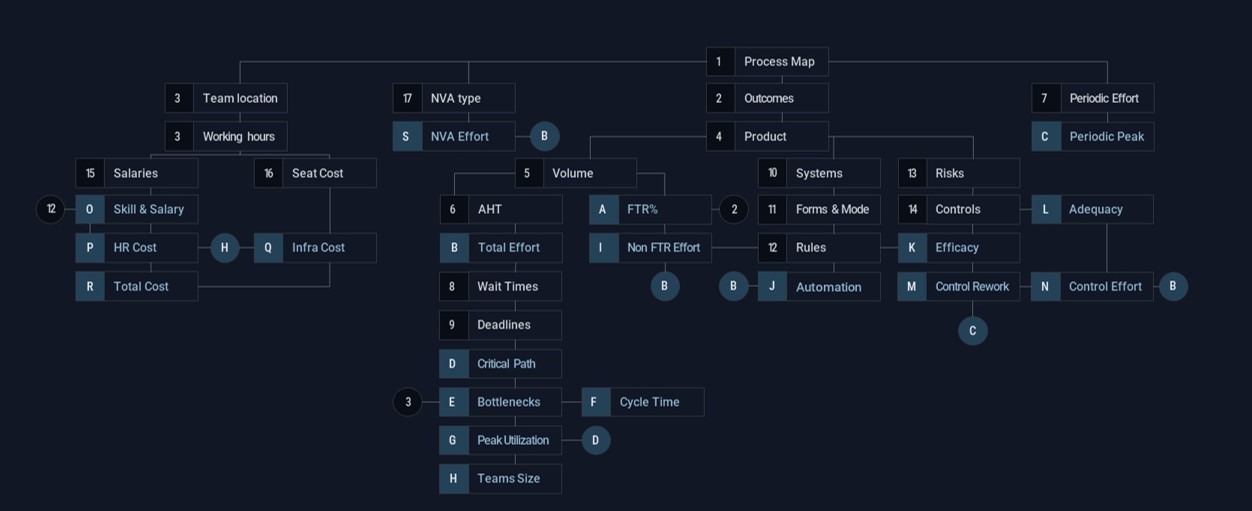
Process Map Process Flow Walk-through
Input a Level 3 cross functional process map
| What you should do | Impact of not following | How to detect the issue | How to resolve the issue |
|---|---|---|---|
| Single file per project (multiple tabs or pages are permitted) | Each file creates only one project. Uploading a second file will overwrite the existing project resulting in data loss | Examine the number of files before uploading the project on 3-Cubed | Copy the contents of the extra files into a single file. Use multiple pages if required as a 3-Cubed project allows multiple pages. |
| Basic Process Flow shapes (if using Visio) Start/End, Activity, Decision, Arrow, Swimlane, On and Off page references | 3-Cubed tries to convert non-recognized shapes into Activity shapes. May generate an error message on process upload | In case of errors on uploading, check referenced shape. Also check if shapes have been ‘grouped” which also shows as error. | Ungroup the shapes and / or replace the non-compliant shape in Visio or BPMN before re-uploading on 3-Cubed. |
| Start and End shapes correctly mapped in process map with clear text to understand start trigger and end outcome | May not capture end to end and miss out the true impact of upstream processes on downstream Peak utilization and Cycle time | Error message asking to create start (for any shape with no incoming arrows) and end (for shape with no outgoing arrows. Mentions # of start and end shapes once process loaded. Check if correct. | Ideally, inspect process prior to upload.
|
| Draw all teams associated with the operation whether in or out of scope. |
|
1.Team location does not show all the teams that impact the operations 2.Multiple Team location required to represent the arrival patterns to each team 3.cycle time or Peak Utilization calculations do not factor in upstream or out of scope impact 4.Forms or cycle time suddenly appear in the process map with no prior reference 5.Control Adequacy seems low because controls are performed by out-of-scope teams | Inspect process prior to upload. Ensure the teams are captured in chronological starting with the trigger and then tracing the transaction flow to all the teams that touch it until it completes (desired, or undesired end) These teams may be in-scope or out of scope and the level of detail for out-of-scope teams can be minimal, so long as we record that the downstream teams have some dependency on them. |
| Ensure decisions and branches are correctly represented in the process map | Erroneous volume split leading to volume sink and source errors | volume validation points to a sink and source error | Inspect process prior to upload. Check activities with multiple outgoing arrows. If the volume flowing in the arrows is a %age of the activity volume, change it to a decision. Check activities with multiple incoming arrows. If the arrows are coming in from a decision, the volume is likely to be SUM, else volume is likely to be MIN. Correct sink and source error as guided in volume validation |
| Process map should have, decisions, show rejections and rework | May not capture all the variations required for a nuanced solution Ignores First Time Right metrics and the effort associated with them | No ‘undesired’ outcome in the process map and no loop warning Possible misrepresentation of First Time Right if rework and reject steps not captured Lower utilization since rework effort not captured Lower cycle time because variants or non First Time Right not captured | Inspect process prior to upload. Trace the transaction through the process to identify where decisions are taken and add these decision shapes. Rework occurs when one arrow goes from a decision to a previous activity Identify the decision(s) that lead to transaction rejection If variants do not follow the same steps, draw a decision to identify these, before returning to the process backbone |
| Process map should not have significantly less than 50 activities | Same issues as above. Additionally, bunched activities may not provide correct information on automation potential, NVA, or control High AHT (>30% per item) may result in higher than true utilization Skills and competency may get wrongly aggregated within an umbrella activity | # of process steps is significantly less than 40 activities High AHT (>30 minutes) for certain activities 3-Cubed does not permit AHT of greater than 1 day peak utilization and bottlenecks seems to be very high because of certain activities Multiple systems represented in the activity whereas the systems are sequential Multiple Formsor rules required to describe the activity whereas these are sequential | Inspect process prior to upload See if the addition of variants or decisions brings the process to within 50-80 steps Check the AHT of the activities. Where the AHT is more than 30 minutes, consider splitting the activity. Check the Formsand business rules associated with the activity. If there are more than 3 Forms, or more than 8 business rules, consider splitting the activity.Check the systems used. Consider splitting activity if > 3 systems |
| Process map has significantly more than 80 activities | A lot of extra effort in building and validating the model Needs volume and AHT at this same level of granularity Fragmented effort leading to potential miss due to non-materiality Extra effort and errors in filling up systems , Forms and Rules Likely errors in mapping leading to incorrect FTR,Automation , skill and clusters , and control efficacy Extra effort and errors in filling up skill and clusters and risk activities Likely errors in lines of defense and in control effort Extra effort and room for error in filling up NVA Longer time and more difficult to solution given fragmented activities effort levers may be missed due to non-materiality [Automation, NVA, FTR] Peak Utilization Peak Utilizatione and Bottlenecks Task Allocation and Skill Clusters may be over-fitted | Estimate the number of activities before uploading Refer warning on Process page once uploaded Check number of paths post Process upload. If number of paths > 50% of # activities, consider merging paths Multiple activities with volume ~ 0-2 of total volume while entering volume data AHT not available for each activity on process, or AHT = 0 or less than 15 seconds Multiple activities with effort &less; 1 hour Multiple paths with effort less than 1 FTE (8 hours) systems , Forms and Business Rules repeated multiple times for adjacent activities Skills validation graph shows flat line or no clear elbow (over-fitting) Difficulty identifying control activities or risk activities | Inspect process and data prior to upload If number of activities significantly greater than 80, look to merge activities If more than 5 consecutive decisions when tracing the transaction, check if each is material If volume or AHT data at higher level of granularity, look to reconcile granularity If consecutive activities are performed by the same team, have the same input and output (product), uses the same system(s), have the same form you should probably merge the activity Consider leaving the activity separate only if either is required to insert a wait period or deadline, is explicitly a control, or a non-value- added activity Periodically use the merge activity functionality in the product to merge activities Check post input of process map for # of activities and paths Check post volume for volume greater than 1% of total volume Check post entering AHT for activity AHT ; 30 seconds, activity effort; 2 hours and path effort 1 FTE (8 hours) |
Outcomes Process Flow Walk-through
Select End shapes and mark rejections as ‘Undesired’
| What you should do | Impact of not following | How to detect the issue | How to resolve the issue |
|---|---|---|---|
| Start and End shapes correctly mapped in Process Map with clear text to understand start trigger and end outcome | May not capture the volume and path for rejected activities and create error in First Time Right | Mentions # of start and end shapes once process map loaded. Check if correct. | Ideally, inspect process prior to upload. # of end shapes should equal number of possible final outcomes. If all ends have been taken to a ‘super’ end, create at least two ‘super’ ends; one for rejections and the other for desired ends Label end shapes with “END:” and mention the outcome to help with Undesired Outcome |
| Process map should have, decisions, show rejections and rework | Ignores First Time Right s and the Non FTR effort associated with items that get rejected | No ‘undesired’ outcome in the process map and no loop warning Possible misrepresentation of First Time Right if reject steps not captured | Inspect process prior to upload. Trace the transaction through the process to identify where decisions are taken. Identify the decision(s) that lead to rejection of the transaction |
| Shows all teams associated with the operation whether in or out of scope. | Teams that are responsible for rejections and rework may not be shown resulting in incorrect First Time Right | End activity is within an in-scope team as a hand-off, whereas the actual rejection (or rework) happens through an out-of-scope team | Inspect process prior to upload. Ensure the teams are captured in chronological starting with the trigger and then tracing the transaction flow to all the teams that touch it until it completes (desired, or undesired end) |
Team Details Process Flow Walk-through
Enter team location; work time; in or out of scope; human or system. Enter size for in-scope, human teams.
| What you should do | Impact of not following | How to detect the issue | How to resolve the issue |
|---|---|---|---|
| Draw all teams associated with the operation whether in or out of scope. | Might miss out on how upstream or out of scope team impact on in-scope and downstream teams Teams that are responsible for rejections and rework may not be shown resulting in incorrect First Time Right | Team Location does not show all the teams that impact the operation Multiple Timers required to represent the arrival patterns to each team cycle time or Peak Utilization calculations do not factor in upstream or out of scope impact Formsor Business Rules suddenly appear in the process map with no prior reference Control Adequacy is low because controls are performed by out-of-scope teams | Inspect process prior to upload. Ensure the teams are captured in chronological starting with the trigger and then tracing the transaction flow to all the teams that touch it until it completes (desired, or undesired end) These teams may be in-scope or out of scope and the level of detail for out-of-scope teams can be minimal, so long as we record that the downstream teams have some dependency on them. |
| Do not team for each location, particularly out of scope teams. | Multiple redundant teams in process map with similar activities, leading to over detailed Process Map (> 80 activities) and attendant issues | Multiple teams’ information to be filled in | Pick a representative location (and time zone). Adjust working hours accordingly if required. |
| For work hours, enter the time a person is present in the office, not adjusted for breaks or other shrinkage | Erroneous scheduling and therefore false , Peak Utilization and hand -of delays leading to increased team size because of artificial “non-availability” of resources | 1.cycle time is higher because of incorrect hand-off delays 2. Peak Utilization is higher because of a shorter ‘shift’ duration | Enter the total time that resources are in office for the Geoloacte Teams input Manage the utilization metric to account for breaks and shrinkages rather than reduce true availability |
| For team size, enter the total number of employees per in-scope team doing the tasks in the process map (including ‘buffer’), not just the planned number of employees or calculated FTE | Will not allow user to proceed if employees &less; daily effort so Note: Rework effort is added to total effort for minimum team size input Incorrect utilization , and hand-off delays because of artificial “non-availability” of resources | Total effort per team is cannot be higher than the # of employees provided ÷ work hours 3-Cubed increases the team size during the computation to ensure adequate resources to complete activities Total HR Cost does not reconcile because of incorrect team size | Provide the total number of employees per team (for which salaries are being paid) rather than adjust for shrinkage, buffers or other considerations Manage the utilization metric to account for breaks and shrinkages rather than reduce true availability |
Product Process Flow Walk-through
Provide the textual input and output for process activities
| What you should do | Impact of not following | How to detect the issue | How to resolve the issue |
|---|---|---|---|
| Products are used to help users manage volume flow (when one root product separates into multiple [e.g., 1 car = 4 wheels] map Formsto activities since Formsare likely associated with products [e.g., application (product) has application form, identity proof, financial proof] Identify risk and control activities since control objectives are typically linked to product names Keep products simple. Most processes do not need more than 3-4 products | A lot of extra effort in building and validating the model More room for error in multiple product conversions leading to volume source and sink errors Extra effort and errors in filling up Forms and Business Rules Extra effort and errors in identifying Forms and Business Rules and controls and risk activities | Estimate the number of products before uploading Similar systems , Forms and Business Rules repeated for products Skills validation graph shows flat line or no clear elbow (over-fitting) Difficulty identifying controls activities and risk activities | Inspect process and data prior to upload If required check synonyms for child products, so multiple child products be represented by a single root |
| The root product is always associated with a start activity. If different start activities converge, you may want to consider a ‘root’ product that encompasses both. | volume source and sink errors when different products merge to a common path in the process | Inability to use SUM or MIN for volume flow because of differing products, resulting in source and sink errors | Inspect process prior to upload. Ensure the teams are captured in chronological starting with the trigger and then tracing the transaction flow to all the teams that touch it until it completes (desired, or undesired end) Mark products used in the transaction flow to ensure the right number of products and correct root and child product names |
| Ensure conversion ratios do not result in fractional volumes Use conversion ratios like 2, 4, 5, 10 rather than 3, 6, 7 or 9 | volume source and sink errors when different products merge to a common path in the process | Source and sink errors in volume flow through the volume validation dialogue. | Edit conversion ratios to ensure that the conversion ratio (or its reciprocal) does not result in a fraction. Take extra care when multiple ‘child’ products have different conversion ratios |
Volume Process Flow Walk-through
| What you should do | Impact of not following | How to detect the issue | How to resolve the issue |
|---|---|---|---|
| Process map should not have significantly more than 80 activities | A lot of extra effort in entering and validating volume May not have volumes at the same level of granularity volume may be 0 due to multiple non-material decisions |
|
Inspect process and data prior to upload If number of activities significantly greater than 80, look to merge activities If more than 5 consecutive decisions when tracing the transaction, check if each is material Use the merge activity functionality in the product to merge activities Check post input of process map for # of activities and paths Check post volume for volume = 0 or 1 |
| The root product is always associated with a start activity. If different start activities converge, you may want to consider a ‘root’ product that encompasses both. | volume source and sink errors when different products merge to a common path in the process |
|
Inspect process prior to upload. Ensure the teams are captured in chronological starting with the trigger and then tracing the transaction flow to all the teams that touch it until it completes (desired, or undesired end) Mark products used in the transaction flow to ensure the right number of products and correct root and child product names |
| Ensure conversion ratios do not result in fractional volumes | volume source and sink errors when different products merge to a common path in the process | Edit conversion ratios to ensure that the conversion ratio (or its reciprocal) does not result in a fraction. Take extra care when multiple ‘child’ products have different conversion ratios | |
| Ensure decisions and branches are correctly represented in the Process Map Ensure the volume flow from a decision or branch is correctly entered while filling up volume | Erroneous volume split leading to volume sink and source errors Erroneous effort because volume is directed to a wrong path if the volume split is incorrectly directed | Inspect process prior to upload. Check activities with multiple outgoing arrows. Ensure that decisions are captured as such and not as branches Check activities with multiple incoming arrows. If arrows are from a decision, the volume is likely SUM, else MIN. Correct sink and source error as guided in volume validation Correct volume flow for incorrect activity effort | |
| Avoid sink and source errors | Inability to proceed further | Sink and source error | Reach support@insorce.com in case of continued sink & source. |
First Time Right Process Flow
Validate rejection and rework volumes against expected metrics
| What you should do | Impact of not following | How to detect the issue | How to resolve the issue |
|---|---|---|---|
| Draw all teams associated with the operation whether in or out of scope. | Teams that are responsible for rejections and rework may not be shown resulting in incorrect First Time Right and effort of correcting | Team Location does not show all the teams that impact the operation Calculation of First Time Right is incorrect | Inspect process prior to upload. Ensure the teams are captured in chronological starting with the trigger and then tracing the transaction flow to all the teams that touch it until it completes (desired, or undesired end) |
| Process map should have, decisions, show rejections and rework | May not capture all the variations required for a nuanced solution Ignores First Time Right metrics and the effort associated with them | No ‘undesired’ outcome in the process map and no loop warning Possible misrepresentation of First Time Right if rework and reject steps not captured | Inspect process prior to upload. Trace the transaction through the process to identify where decisions are taken and add these decision shapes. Rework occurs when one arrow goes from a decision to a previous activity Identify the decision(s) that lead to transaction rejection |
| Start and End shapes correctly mapped in process map with clear text to understand start trigger and end outcome | May not capture the volume and path for rejected activities and create error in First Time Right | Mentions # of start and end shapes once process map loaded. Check if correct. | Ideally, inspect process prior to upload. # of end shapes should equal number of possible final outcomes. If all ends have been taken to a ‘super’ end, create at least two ‘super’ ends; one for rejections and the other for desired ends Label end shapes with “END:” and mention the outcome to help with Undesired Outcomes |
| Confirm the volume that is rejected | Incorrect First Time Right volume and estimate of effort spent on items that get rejected | Calculation of First Time Right is incorrect and does not tally with management expectation of rejection rate as per the scope and intent document | Calculation of First Time Right is incorrect and does not tally with management expectation of rejection rate as per the scope and intent document |
| Confirm the volume that is subject to rework | Incorrect volume and estimate of effort spent on rework | Calculation of First Time Right is incorrect and does not tally with management expectation of rework as per the scope and intent document | Check the decision at which the rework takes place and validate the % volume Remember Total rework = 1/(1-rework%) since reworked items themselves may be subject to re-rework If the volume is correct, assess the possible reason for the rejection and capture this in the FTR comments |
Average Handle Time(AHT) Process Flow Walk-through
Input time taken to perform the activity
| What you should do | Impact of not following | How to detect the issue | How to resolve the issue |
|---|---|---|---|
| Process map should not have significantly less than 50 activities | High AHT (>30 minutes per item) may result in higher than true utilization | High AHT (>30 minutes) for certain activities 3-Cubed does not permit AHT of greater than 1 day Peak Utilization and Bottlenecks seems to be very high because of certain activities | Inspect process prior to uploadCheck variants to the process This can also help if management believes there is significant, material variability in AHT, you can create variants for the high-average-low AHT Check the AHT of the activities. Where the AHT is more than 30 minutes, consider splitting the activity. |
| Process map has significantly more than 80 activities | A lot of extra effort in building and validating the model AHT not available at the same granularity Fragmented effort leading to potential miss due to non-materiality | Estimate the number of activities before uploading Refer warning on Process page once uploaded AHT not available for each activity on process, or AHT = 0 or less than 15 seconds Multiple activities with effort < 1 hour | Inspect process and data prior to upload If number of activities significantly greater than 80, look to merge activities If AHT data at higher level of granularity, look to reconcile granularity If consecutive activities are performed by the same team, have the same input and output (product), uses the same system(s), have the same form you should probably merge the activity Use merge activity functionality to merge activities Check AHT for activity AHT < 30 seconds, activity effort < 2 hours |
| Capture true estimates of average handle time, not maximum handle time Note if using time-stamp information for AHT that time stamps include AHT and wait time and need adjustment to remove wait periods. | Incorrect (over-estimated) effort, Peak Utilization , FTE required, and cycle time | Warning that effort is greater than team size provided Peak Utilization is higher than management expectation in scope & intent document 3-Cubed increases the team size after running the Peak Utilization | Inspect effort for each activity and identify outliers. Check if effort is overly high because on incorrect AHT. Inspect effort of activities that are on the Peak or that are causing bottlenecks . Check if the effort is overly high because of AHT. |
| Enter AHT with reference to the product to ensure correct unit of measurement | Wrong effort particularly if there is a conversion ratio between | Incorrect effort for activities | Inspect effort for each activity and check if effort is wrong consistently for a particular product . If so, correct AHT or the conversion ratio. |
Total Effort Process Flow
| What you should do | Impact of not following | How to detect the issue | How to resolve the issue |
|---|---|---|---|
| Process map should not have significantly more than 80 activities | Fragmented effort leading to potential miss due to non-materiality | Multiple activities with effort < 1 hour Multiple paths with effort less than 1 FTE (8 hours) | Use the merge activity functionality in the product to merge activities Check post entering AHT for activity AHT; 30 seconds, activity effort < 2 hours and path effort < 1 FTE (8 hours) |
| Ensure volume flow from a decision or branch is correctly entered while filling up volume | Erroneous effort because volume is directed to a wrong path if the volume split is incorrectly directed | Incorrect effort for activities and paths because of incorrect volume directed at decision points | Inspect process prior to upload. Check activities with multiple outgoing arrows. Ensure that decisions are captured as such and not as branches Check activities with multiple incoming arrows. If arrows are from a decision, the volume is likely SUM, else MIN. Correct volume flow for incorrect activity effort |
| Capture true estimates of average handle time, not maximum handle time | Incorrect (over-estimated) effort, Peak Utilization , FTE required, and cycle time | Warning that effort is greater than team size provided | Inspect effort for each activity and identify outliers. Check if effort is overly high because on incorrect AHT. |
| Enter AHT with reference to the product to ensure correct unit of measurement | Wrong effort particularly if there is a conversion ratio between products | Incorrect effort for activities | Inspect effort for each activity and check if effort is wrong consistently for a particular product. If so, correct AHT or the conversion ratio |
| Confirm the effort for each activity, particularly where effort >= 8 hours | Incorrect Peak Utilization , cycle time, FTE required and Total Cost Wrong opportunity size for NVA , automation , control and non FTR required Incorrect impact analyses for all effort, Peak and cycle time levers | Incorrect Peak Utilization , cycle time, FTE required and Total Cost Wrong opportunity size for NVA , automation , control and non FTR | Check the volume and the AHT for each high effort activities to ensure correctness. Important to spend some time as multiple impact on other metrics and will cause a lot of rework if not done correctly |
| Note that effort volume x AHT for each activity. The effort does not change because of wait times or bottlenecks. Remember to adjust time-stamp information into AHT and wait time. | |||
Total Effort-2 Process Flow
| What you should do | Impact of not following | How to detect the issue | How to resolve the issue |
|---|---|---|---|
| For team size, enter the total number of employees per in-scope team doing the tasks in the process map | Will not allow user to proceed if employee ; daily effort so Note: Rework effort is added to total effort for minimum team size | Total effort per team is cannot be higher than the # of employee provided ÷ work hours Total HR Cost does not reconcile because of incorrect team size | Provide the true total number of employees per team (for which salaries are being paid) without adjusting for shrinkage, buffers or other considerations Check effort of activities by team to see if there are errors or in AHT causing an increase in the effort per team |
| Check overall Peak Utilization against the scope and intent document to ensure that the Total effort reflects management view of reality | Incorrect Peak Utilization , cycle time, FTE required and Total Cost Wrong opportunity size for NVA , automation , control and non FTR Incorrect impact analyses for all effort, Peak Utilization and cycle time levers | Total effort per team is cannot be higher than the # of employee provided ÷ work hours , i.e. Peak Utilization is >= 100% Check if model utilization is If Peak Utilization is significantly different from the estimate provided in the scope and intent document, | *STAR TIP:* If utilization > 100%, check AHT and volume estimates, work hours and # of employee provided If the team is genuinely ‘stretching’ you may need to increase work hours per team. Do not adjust for shrinkage, buffers or other considerations in # of employee If Peak Utilization is significantly lower than provided in the scope and intent document, check if the Process Map covers the entire scope, including variations If Peak Utilization is significantly higher than provided in the scope and intent document, check the process Map for duplicated activities by the team; or incorrect AHT and volume estimates Check if volume are daily volumes and if the AHT is provided for the right product . |
Periodic effort
Capture effort of activities that do not occur every day, but at specified intervals
- Periodic activities do not contribute to cycle time, as the duration in which they are to be performed is the cycle time for these.
- Since cycle time is computed through the scheduling algorithm, and that is not relevant for periodic activities, we only need effort, periodicity and duration for periodic activities, not volume and AHT
- We do not associate wait time or deadlines with periodic activities. The end date for periodic activities is their deadline and the periodicity for individual activities is the wait period between these.
- Minimum FTE required is computed the sum of the effort required for daily activities and the annual peak caused by periodic activities
| What you should do | Impact of not following | How to detect the issue | How to resolve the issue |
|---|---|---|---|
| Earmark periodic (non-daily) activities in the Process Map | Periodic activities treated as daily activities with no separate periodic peak | No periodic activities available when fill periodic effort | Return to the Process Map and mark designated activities as periodic activities |
| Include the effort caused by rework in the effort estimate for periodic activities | Incorrect effort because of rework could lead to lower periodic peak than true | Rework shown periodic activities does not reflect in non FTR effort periodic peaks are lower than expected in scope and intent document because they do not include rework | Edit the effort caused by rework of in the effort estimate for each periodic activities |
| Include wait times between periodic activities by changing the start date for the subsequent periodic activities | May lead to incorrect periodic peak and minimum FTE required | periodic peak are different from expectation in scope and intent document because they do not include wait times | Edit the start date for the subsequent periodic activity to capture the wait period if relevant |
| Include deadlines for periodic activities by changing the end date and periodicity for relevant periodic activity | May lead to incorrect periodic peaks and minimum FTE required | periodic peaks are different from expectation in scope and intent document because they do not include the end time or deadlines | Edit the end date and periodicity for the for relevant periodic activity to capture the implicit deadlines |
NVA Type Process Flow Walk-through
Earmark and check activity type by classifying activities as Action (non-NVA), Routing, Recording, or Reporting
| What you should do | Impact of not following | How to detect the issue | How to resolve the issue |
|---|---|---|---|
| Process map should not have significantly less than 50 activities | Bunched activities may not provide correct information on NVA | # of process steps is significantly less than 40 activities Multiple NVA classification possible | Inspect process prior to upload Check the AHT of the activities. Where the AHT is more than 30 minutes, consider splitting the activity. Check the Formsand business rules associated with the activity. If there are more than 3 Forms, or more than 8 business rules, consider splitting the activity. Check the systems used. Consider splitting activity if > 3 systems |
| Process map should not have significantly more than 80 activities | Extra effort and room for error in filling up NVA | Multiple, sequential activities share either the same NVA classification or alternate between NVA classifications | Inspect process and data prior to upload If number of activities significantly greater than 80, look to merge activities |
| Select the auto-classify method to allow 3-cubed to classify the activities, but then check the auto-classification | Erroneous classification of activities, leading to: Missing out on potential effort reduction, or Wrong treatment to reduce effort | NVA effort does not match with expectation in scope and intent document NVA effort significantly lower than 15% of total effort; or significantly greater than 30% of total effort | Check the auto-classification in the following order: Routing: These relate to transformation of information typically to other teams and include emails, messages, approvals or information requests Reporting: These relate to reports to be prepared, sent, reviewed or commented upon. These are typically part of control activities, but not always. They normally contain a report in the forms. Recording: These relate to data entry from one systems to another or from images to digital files. These are often marked by change in mode and introduction of a digital forms, and by change systems and applications Action: If activities do not fall into the above categories, they are likely to be non-NVA |
NVA Effort Process Flow
Validate effort spent on NVA, the reasons for these and potential solutions
| What you should do | Impact of not following | How to detect the issue | How to resolve the issue |
|---|---|---|---|
| Ensure that effort has been validated and no volume and AHT errors | Incorrect NVA effort | Incorrect Total effort, cycle time, # of FTE /td> | Check the volume and the AHT for each NVA Activity to ensure correctness |
| Select the auto-classify method to allow 3-cubed to classify the activities, but then check the auto-classification | Erroneous classification of activities, leading to: Missing out on potential effort reduction, or Wrong treatment to reduce effort | NVA effort does not match with expectation in scope and intent document NVA significantly lower than 15% of total effort; or significantly greater than 30% of total effort | Check the auto-classification in the following order: Routing: These relate to transformation of information typically to other teams and include emails, messages, approvals or information requests Reporting: These relate to reports to be prepared, sent, reviewed or commented upon. These are typically part of control activities, but not always. They normally contain a report in the forms. Recording: These relate to data entry from one systems to another or from images to digital files. These are often marked by change in mode and introduction of a digital forms, and by change systems and applicationsAction: If activities do not fall into the above categories, they are likely to be non-NVA |
| Validate the effort spent on NVA and type of NVA to resolve | Incorrect impact analyses for all effort, Peak and cycle time levers | Incorrect NVA effort: Total and by NVA Type | Check the NVA type to assess: Routing: Is there multiple to-and-fro, and can this be reduced? Rather than email, can this be digital, or workflow driven? Reporting: Is there multiple reporting of the same information? Can these be consolidated? Instead of manual reporting, can these be automated? Recording: Which are the Formsthat need data entry? Can these be digitized? Why is information not flowing from one system to another? Can this be automated? Why are we using multiple systems? Can these not be consolidated? |
Periodic Peak
Verify annual peaks caused by periodic activities based on their effort, periodicity and duration; and FTE required to staff these.
- Periodic activities do not contribute to cycle time, as the duration in which they are to be performed is the cycle time for these.
- Since cycle time is computed through the scheduling algorithm, and that is not relevant for periodic activities, we only need effort, periodicity and duration for periodic activities, not volume and AHT
- We do not associate wait time or deadlines with periodic activities. The end date for periodic activities is their deadline and the periodicity for individual activities is the wait period between these.
- Minimum FTE required is computed the sum of the effort required for daily activities and the annual peak caused by periodic activities
| What you should do | Impact of not following | How to detect the issue | How to resolve the issue |
|---|---|---|---|
| Earmark periodic peak (non-daily) activities in the Process Map | periodic activities treated as daily activities with no separate periodic peak | No periodic activities available when filling in periodic effort | Return to the Process Map and mark designated activities as periodic activities |
| Include the effort caused by rework in the effort estimate for periodic activities | Incorrect effort because of rework could lead to lower periodic peak than true | Rework shown periodic activities does not reflect in non FTR effort periodic peak are lower than expected in scope and intent document because they do not include rework | Edit the effort caused by rework of periodic activities in the effort estimate for each periodic activity |
| Include wait times between periodic activities by changing the start date for the subsequent periodic activity | May lead to incorrect periodic peak and minimum FTE required | periodic peak are different from expectation in scope and intent document because they do not include wait times | Edit the start date for the subsequent periodic activity to capture the wait period if relevant |
| Include deadlines for periodic activities by changing the end date and periodicity for relevant periodic activity | May lead to incorrect periodic peak and minimum FTE required | periodic peak are different from expectation in scope and intent document because they do not include the end time or deadlines | Edit the end date and periodicity for the for relevant periodic activity to capture the implicit deadlines |
| Verify the periodic effort and the periodic distribution of the activities annually | May lead to incorrect periodic peak and minimum FTE required | periodic peak appear skewed as against expectation per scope and intent document FTE required per team is not as per expectation per scope and intent document | Check periodic activity effort, periodicity and duration For periodic activities we need to capture the total effort of the activity during the period without adjusting to daily effort |
| Check the rationale for these periods and the duration with notes if these can be changed | Losing out on an important solution lever to deal with periodic peak through longer duration or more frequent periods | No comments in model validation with respect to possible changes in frequency or duration. | Verify the reasons with delivery teams as to why there is no flexibility in timing, frequency or duration for periodic activities and ensure these are noted, particularly for periodic peak . |
Salaries Process Flow Walk-through
Provide average cost per team for in-scope teams to compute HR Cost, Total Cost and see impact of work allocation and training
| What you should do | Impact of not following | How to detect the issue | How to resolve the issue |
|---|---|---|---|
| Ensure all in-scope teams are captured in scope | Might miss out cost of teams that impact operations but are not captured | Team Location does not show all the teams that impact the operation # of FTE , HR Cost and Total Cost do not tally with the scope and intent document | Inspect process prior to upload. Ensure the teams are captured in chronological starting with the trigger and then tracing the transaction flow to all the teams that touch it until it completes (desired, or undesired end) |
| Do not create teams for each location , particularly out of scope teams. | Multiple redundant teams in Process Map with similar activities, leading to over detailed Process Map (> 80 activities) | Multiple team's information to be filled in | Pick a representative location (and time zone). Adjust working hours accordingly if required. Take a weighted average salary across location , if required |
| Do fill in a salary value for in-scope team size ; do not leave blank or 0 | HR Cost and Total Cost incorrect Miss out on work allocation and training levers for solutioning Incorrect HR Cost and Total Cost impact of work allocation and training levers for effort, peak , cycle time, control efficacy and competency | HR Cost and Total Cost do not tally with the scope and intent document Total HR Cost does not reconcile because of incorrect salaries | Provide salary value for all in-scope teams. For fragmented teams across locations, you can provide a weighted average salary In case sensitivity in providing average salary, you can provide proxy salaries, as most of the analytics will provide results based on these numbers. Ensure that you maintain an appropriate ratio between teams when providing proxy salary Sites like monster.com, glassdoor.com provide salary bands for different roles. You can use these as proxies for salaries |
| Do fill in a benchmark cost for in-scope teams; do not leave blank or 0 | Miss out on work allocation and training levers for solutioning Incorrect HR Cost and Total Cost impact of work allocation and training levers for competency | Warning in the salary input screen that benchmark cost has not been updated. | In case of sensitivity, you can provide proxy salaries, as most of the analytics will provide results based on these numbers. Sites like monster.com, glassdoor.com provide salary bands for different roles. You can use these as proxies for salaries |
Systems & Application Process Flow Walk-through
Enter the systems and applications used in the process to help with selection of Forms, business rules and for automation analysis
| What you should do | Impact of not following | How to detect the issue | How to resolve the issue |
|---|---|---|---|
| Process map has significantly more than 80 activities | Extra effort and errors in filling up systems s, Formsand business rules Likely errors in mapping leading to incorrect FTR, automation potential, skill clusters, and control efficacy | Refer warning on Process page once uploaded Activities with volume ~ 0-2, AHT less than 15 seconds, or effort < 1 hour Systems, Formsand business rules repeated multiple times for adjacent activities | Periodically use the merge activity functionality in the product to merge activities Check post entering AHT for activities AHT < 30 seconds, activities effort < 1 hours |
| Do not combine systems names together using “&”, ”and”, “/”, “|”, or other characters. systems names should be entered a comma separated values else the two separate systems will be treated as a single system. | Difficulty in filling system related Forms, modes and business rules Incorrect automation assessment and missing automation potential | Check systems names after entering to ensure the entered names are correct | Make a list of systems names and add them to the systems s input box Select activities associated with the system using the systems s input screen. |
| Ensure all activities that use any systems do have the systems name associated with them | Difficulty in filling system related Forms, modes and business rules Inability to associate Formsthat are transmitted via workflow with the activities Incorrect automation assessment and missing automation potential | Error message stating that it is not possible to have workflow as mode since systems is missing Validate systems names after entering | Check validation in systems input screen to find the activities that have no systems associated with them |
Seat Cost Walk-through
Provide average cost per seat for in-scope locations to compute Infrastructure Cost, Total Cost
| What you should do | Impact of not following | How to detect the issue | How to resolve the issue |
|---|---|---|---|
| Ensure all in-scope teams are captured in scope | Might miss out cost of locations that impact operations but are not captured | Team Location does not show all the teams that impact the operation HR Cost, Infrastructure Cost, Total Cost do not tally with the scope and intent document | Inspect process prior to upload. Ensure the teams are captured in chronological starting with the trigger and then tracing the transaction flow to all the teams that touch it until it completes (desired, or undesired end) |
| Do not create teams for each location, particularly out of scope teams. | Multiple redundant teams in process map with similar activities, leading to over detailed process map (> 80 activities) | Multiple team's information to be filled in | Pick a representative location (and time zone). Adjust working hours accordingly if required. Take a weighted average seat cost across locations, if required |
| Do fill in a salary value for in-scope team size ; do not leave blank or 0 | Infrastructure Cost and Total Cost incorrect Miss out on location and levers for solutioning Incorrect Infrastructure Cost and Total Cost impact for automation, shifts, and work allocation levers | Infrastructure Cost and Total Cost do not tally with the scope and intent document Infrastructure Cost does not reconcile because of incorrect seat cost . | Provide seat cost salary value for all in-scope locations. For fragmented teams across locations, you can provide a weighted average salary In case sensitivity in providing average salary, you can provide proxy seat cost, as most of the analytics will provide results based on these numbers. Ensure that you maintain an appropriate ratio between teams when providing proxy salary In case of new locations, 3-Cubed allows users to build out seat cost by providing prices for rent, office infrastructure, equipment, systems and applications |
Control Objectives
Enter the purpose of controls in the operation; what is the operation trying to achieve?
| What you should do | Impact of not following | How to detect the issue | How to resolve the issue |
|---|---|---|---|
|
|
|
|
Skill & Salary
Validate the competencies of teams and compare to the salary levels to see if there are any discrepancies in either
| What you should do | Impact of not following | How to detect the issue | How to resolve the issue |
|---|---|---|---|
| process map has significantly more than 80 activities | Likely error in Forms Business Rules leading to wrong competency | Multiple control activities mapped to a single control (> 6 activities) | Inspect process map and data prior to upload Use the merge activity functionality in the product to merge activities where > 6 activities required for single control |
| Process map has significantly more than 80 activities | Extra effort and errors in filling up Forms Business Rules and competency leading to likely errors skill n clusters | Refer warning process map page once uploaded Activities with volume ~ 0-2, AHT less than 15 seconds, or effort < 1 hour | Periodically use the merge activity functionality in the product to merge activities Check post entering AHT for activities AHT < 30 seconds, activities effort < 1 hours |
| Rationalize the Business Rules that you put into the model. | Likely errors in mapping , skill n clusters and | Many fact-based Business Rules associated with each activity | Make a list of Business Rules prior to uploading, check for duplicates Check if any rules are duplicates of each other, Check spellings of rules before upload or data entry |
| Ensure the competency for rules are correct. | Use the merge activity functionality in the product to merge activities where > | Multiple or unclear elbow diagram in Competency validation activity k-Clusters Mismatch between team salary vs competency graph | Check k-clusters suggested. Check if each cluster has similar systems , Forms Business Rules. If clusters are skewed, or do not show correct results rationalize # of activities,systems , Forms Business Rules In case of continuing issues, reach out to support@insorce.com |
| Do fill in a salary value for in-scope teams; do not leave blank or 0 | HR Cost and Total Cost incorrect Incorrect HR Cost and Total Cost impact of work allocation and training levers for effort, peak, cycle time, control efficacy and competency | HR Cost and Total Cost do not tally with the scope and intent document Total HR Cost does not reconcile because of incorrect salaries | Provide salary value for all in-scope teams. For fragmented teams across locations, you can provide a weighted average salary In case sensitivity in providing average salary, you can provide proxy salaries |
| Check reasons for higher HR Cost by team | Not having a clear view of when to use work allocation, location change and training levers for effort, peak, cycle time, control efficacy and competency, HR Cost and Total Cost | No view on what makes the teams more expensive when using work allocation, location change, and training levers for effort, peak, cycle time, control efficacy and competency, HR Cost and Total Cost | *STAR TIP*: Check team competency and salary in the salary and compensation graph. Assess how much higher competency contributes to higher cost using Benchmark Cost . *STAR TIP*: For teams with similar competency, check the impact of location on HR Cost . Assess if similar competency is available alternate locations to reduce HR Cost |
Periodic Effort
Capture effort of activities that do not occur every day, but at specified intervals
- Periodic activities do not contribute to cycle time, as the duration in which they are to be performed is the cycle time for these.
- Since cycle time is computed through the scheduling algorithm, and that is not relevant for periodic activities, we only need effort, periodicity and duration for periodic activities, not volume and AHT
- We do not associate wait time or deadlines with periodic activities. The end date for periodic activities is their deadline and the periodicity for individual activities is the wait period between these.
- Minimum FTE required is computed the sum of the effort required for daily activities and the annual peak caused by periodic activities
| What you should do | Impact of not following | How to detect the issue | How to resolve the issue |
|---|---|---|---|
| - | - | - | - |
HR Cost
Validate HR Cost for the operation and for each in-scope team. Assess reasons for the cost and possible ways to reduce it.
- Since # of FTE and salaries have already been completed, users should validate those before working on this validation.
| What you should do | Impact of not following | How to detect the issue | How to resolve the issue |
|---|---|---|---|
|
|
*STAR TIP*: Create a test scenario where you reset team size and add FTE based on desired utilization levels. Run the scheduling algorithm. Check what is the team size required, and what is the new cycle time. This provides an estimate of teamwise overcapacity, if any and relative team sizing. | |
|
|
|
|
|
|
No view on what makes the teams more expensive when using work allocation, location change, and training levers for effort, peak, cycle time, control efficacy , competency, HR Cost and Total Cost | *STAR TIP*: Check team competency and salary in the salary and compensation graph. Assess how much higher competency contributes to higher cost using Benchmark Cost .
*STAR TIP*: For teams with similar competency, check the impact of location on HR Cost . Assess if similar competency is available alternate locations to reduce HR Cost |
Infrastructure Cost
Validate Infrastructure Cost for the operation and for each in-scope location. Assess reasons and possible ways to reduce it.
- Since # of FTE have already been completed, users should validate these before working on this validation.
| What you should do | Impact of not following | How to detect the issue | How to resolve the issue |
|---|---|---|---|
|
|
|
*STAR TIP*: Create a test scenario where you reset team size and add FTE based on desired utilization levels. Run the scheduling algorithm. Check what is the team size required, and what is the new cycle time. This provides an estimate of teamwise overcapacity, if any and relative team sizing. |
|
|
|
|
|
|
|
|
|
|
No view on what makes the locations more expensive when using automation, shifts, and work allocation levers | *STAR TIP*: Check team systems s and applications used by teams in each location and see if they contribute to higher seat cost .
*STAR TIP*: For teams with similar systems and applications, and office equipment check the impact of location on Infrastructure Cost. *STAR TIP*: Check when there is Peak Utilization across teams in the locations. Assess if work timing can reduce peak requirement |
Total Cost
Validate Total Cost, viz. HR Cost and Infrastructure Cost
-
Since HR Costand Infrastructure Cost have already been completed, users should validate these before working on this validation.
| What you should do | Impact of not following | How to detect the issue | How to resolve the issue |
|---|---|---|---|
|
|
|
*STAR TIP*: Create a test scenario where you reset team size and add FTE based on desired utilization levels. Run the scheduling algorithm. Check what is the team size required, and what is the new cycle time. This provides an estimate of teamwise overcapacity, if any and relative team sizing. |
|
|
|
|
|
|
|
|
|
|
|
|
|
|
No view on what makes up Total Cost | *STAR TIP*:
|
Wait Times Process Flow Walk-through
Enter wait periods between activity pair to indicate time dependency between predecessor and successor activities
| What you should do | Impact of not following | How to detect the issue | How to resolve the issue |
|---|---|---|---|
|
|
|
|
|
|
|
|
|
|
|
|
|
|
|
•Merge activities if the INST is between two activities of the same team.
•Ensure both teams have the same work times if INST between different team activities, and both teams have sufficient FTE size to cover the effort of the INST activities |
Deadlines Process Flow Walk-through
Enter deadlines to compute their impact on cycle time and ensure the teams have sufficient resources to meet these deadlines
| What you should do | Impact of not following | How to detect the issue | How to resolve the issue |
|---|---|---|---|
|
|
|
|
|
|
|
Critical Path Process Flow
Validate the critical path(s) or the paths that takes the maximum time to complete given effort, team size, wait time and deadlines. Cycle time is critical path plus delays (bottlenecks or hand-off delays)
| What you should do | Impact of not following | How to detect the issue | How to resolve the issue |
|---|---|---|---|
|
|
|
|
|
|
|
|
|
|
|
|
Bottlenecks and Hand-offs Process Flow
Validate the critical path(s) or the paths that takes the maximum time to complete given effort, team size, wait time and deadlines. Cycle time is critical path plus delays (bottlenecks or hand-off delays)
| What you should do | Impact of not following | How to detect the issue | How to resolve the issue |
|---|---|---|---|
|
|
|
Check the AHT of the activities. Where the AHT is more than 30 minutes, consider splitting the activity. |
|
|
|
|
|
|
cycle time is higher than management expectation in scope & intent document
|
|
|
|
|
Check wait periods for process map with multiple incoming arrows and apply the correct wait period between each pair |
|
|
|
1.Inspect where TOD, EOD or BOD are used as wait period and edit the values of these (TOD) to match the actor work times. Consider using POST instead of TOD, BOD or EOD |
| Check cycle time against the scope and intent document and if see if the difference is because of batch or ANY/ALL delays | Scan the process map in advance and note which activities are batch processing, if any. Review activities with multiple incoming arrows see if all arrows or any arrows are required. |
Cycle Time
Check cycle time resulting from effort, team size, working hours, wait time, and deadlines. cycle time = critical path + delays
| What you should do | Impact of not following | How to detect the issue | How to resolve the issue |
|---|---|---|---|
|
|
|
Inspect process prior to upload. •Ensure the teams are captured in chronological starting with the trigger and then tracing the transaction flow to all the teams that touch it until it completes (desired, or undesired end) |
•For work hours, enter the time a person is present in the office, not adjusted for breaks or other shrinkage
|
|
|
|
|
|
|
|
|
|
|
|
|
|
|
|
|
|
|
Peak of utilization
Enter team location; work time; in or out of scope; human or system. Enter size for in-scope, human teams.
| What you should do | Impact of not following | How to detect the issue | How to resolve the issue |
|---|---|---|---|
|
|
||
|
|
|
|
|
|
|
|
|
|
Error message stating that it is not possible to meet the deadline because of the effort of preceding activities
|
|
Peak and utilization
Check daily peaks caused due to effort, team size, working hours, delays and deadlines.
| What you should do | Impact of not following | How to detect the issue | How to resolve the issue |
|---|---|---|---|
|
|
|
|
Team size (# of FTE)
Verify total team size based on peak utilization Team size is defined by the maximum daily peak plus the periodic peak, if any.
| What you should do | Impact of not following | How to detect the issue | How to resolve the issue |
|---|---|---|---|
|
|
|
|
Systems & Applications
Verify total team size based on Peak Utilization Team size is defined by the maximum daily peak plus the periodic peak, if any.
| What you should do | Impact of not following | How to detect the issue | How to resolve the issue |
|---|---|---|---|
|
|
|
|
|
|
|
|
|
|
|
|
Forms and Modes Process Flow Walk-through
Enter the Formsused in the process to help with selection of business rules and for automation and skills analysis
| What you should do | Impact of not following | How to detect the issue | How to resolve the issue |
|---|---|---|---|
|
|
||
|
|
||
|
|
|
|
|
|
|
|
|
|
|
|
Business Rules & Competency Process Flow Walk-through
Enter business rules used in the process to help with and for automation, skills, non FTR effort and control efficacy analyses
| What you should do | Impact of not following | How to detect the issue | How to resolve the issue |
|---|---|---|---|
|
|
*STAR TIP*: Create a test scenario without deadlines and delays to see the peak utilization Introduce the deadlines and delays one by one to check the impact and identify which is causing the cycle time and why. In case of any continued doubts on cycle time, contact support@insorce.com to understand any edge case that causes spikes in cycle time. For example, there may be edge cases that include (but are not limited to) False peaks due to bottlenecks caused by system or out of scope teams
Incorrect impact of model vs team time zones and need to adjust work time by ± 24 hours when team worktime start at midnight
Incorrect relative team sizes or inadvertently running when clicking reset team size |
|
|
|
||
|
|
||
|
|
|
1.Make a list of rules prior to uploading, check for duplicates
a.Check if any rules are duplicates of each other,
Example: Replace ‘client name’, ‘client DOB’ and ‘client address’ with ‘client identity’ b.Check spellings of rules before upload or data entry
Example: ‘client identity’ is different from ‘client ID’ c.Use the synonyms functionality in add rules |
|
|
|
1.Check automation potential by automation type. Verify if there are any inconsistencies because of competency:
Example: Competency is fact instead of judgement resulting in high RPA potential rather than AI/ML |
Non FTR Effort
| What you should do | Impact of not following | How to detect the issue | How to resolve the issue |
|---|---|---|---|
|
|
|
|
|
1.May not capture all non-First Time Right metrics and the effort associated with them |
|
|
|
|
||
|
|
|
|
|
|
|
Automation Process Flow
Validate automatable activities based on modes, business rule competency, effort, peaks and bottlenecks.
| What you should do | Impact of not following | How to detect the issue | How to resolve the issue |
|---|---|---|---|
|
|
|
|
|
|
|
|
|
|
|
|
|
|
|
|
|
|
|
|
|
|
|
|
Control Objectives Walk-through
Enter the purpose of controls in the operation; what is the operation trying to achieve?
| What you should do | Impact of not following | How to detect the issue | How to resolve the issue |
|---|---|---|---|
|
|
|
l.
|
•Look at various source documents to identify the control objective, such as contract, internal audit, goal-sheets, control plans etc. The main categories of objectives include:
|
Controls Process Flow Walk-through
Identify the activities that are controls and identify which of the risk activities may prevent meeting control objectives.
| What you should do | Impact of not following | How to detect the issue | How to resolve the issue |
|---|---|---|---|
|
|
|
|
• Process Map should not have significantly less than 50 activities
|
Bunched activities may be difficult to segregate into control activities or , risk activities leading to incorrect lines of defense and control effort |
.Multiple Wrong opportunity size for automation associated with single activity .Inability to separate control from risk Example: ‘Data enter and maker checker’ |
Inspect process prior to upload
2.Check if you can distinguish the control from the action
|
Process Map has significantly more than 80 activities
|
•Likely errors in mapping all control leading to lines of defense
•Likely error in business rules and Formsleading to wrong control efficacy |
1.Multiple control activities mapped to a single control (> 6 activities)
|
1.Inspect process and data prior to upload
a.Use the merge activity functionality in the product to merge activities where > 6 activities required to define single control
|
•Target 4-8 control objective for analyses to avoid excess granularity (> 8) or excess abstraction (< 4)
|
Incorrect lines of defense and control effort |
1.When mapping controls,
a.most controls have single control objective: too granular
b.Most controls map on to multiple control objectives: too abstracted |
1.Abstract or consolidate control objectives depending on the situation
2.Consider discussion the internal audit, quality or risk management function |
•Select control activities and earmark what control objective they serve
•Check activities adjacent to the control and include them if applicable
•Complete control and will have activities that detect, mitigate, escalate and prevent. Mark all.
|
1.Possible error in lines of defense if multiple activities of the same control are marked as different controls
2.Incorrect control effort if activities are not included in the control
3.Incorrect control rework if decisions are not included in the control |
1.Controls do not seem to have any
control rework
associated with them
2. control effort is less than expected as per the scope and intent document |
*STAR TIP*: Most controls have a decision that causes control rework , typically for the mitigation part of the control. If the control does not have rework, check activities first control does not a decision, look for adjacent activities that are decisions and cause rework. |
•Select risk activities by objective |
Incorrect lines of defense/p> |
1.No risk activities in control validation table
2.Incorrect lines of defense in validation |
Select activities preceding the control activities that create risk *STAR TIP*: not all activities create risk, select those that do. Example: ‘Data enter’ may have risk, ‘Receive mail’ may not |
Control efficacy
Validate the efficacy of existing controls based on placement of control, segregation of duty, and business rules
| What you should do | Impact of not following | How to detect the issue | How to resolve the issue |
|---|---|---|---|
|
|
|
|
|
|
|
|
|
|
|
|
|
|
|
\ |
|
|
|
|
Control Adequacy (Lines of Defense) Process Flow
Check if each objective (and risk type*) has maker, checker, auditor controls – or if they have more, or less, control.
| What you should do | Impact of not following | How to detect the issue | How to resolve the issue |
|---|---|---|---|
|
|
|
|
• Process Map should not have significantly less than 50 activities
.
•Process map has significantly more than 80 activities
|
|
2.Inability to separate control from risk
|
|
Process Map has significantly more than 80 activities
|
|
|
|
Target 4-8 control objective for analyses to avoid excess granularity (> 8) or excess abstraction (< 4)
|
|
|
|
•Ensure that the model shows the correct lines of defense by control objective
|
|
|
|
1.Ensure that the model shows the correct lines of defense by control objective
2.Determine if the lines of defense represents over- or under- control by control objective
|
|
|
|
Control rework
Validate if excess or ineffective controls are driving extra effort and therefore delays and Peak Utilization.
| What you should do | Impact of not following | How to detect the issue | How to resolve the issue |
|---|---|---|---|
|
|
|
|
|
|
|
|
|
|
|
|
|
|
|
|
|
|
|
|
•Confirm the effort to correct the rules |
|
|
|
Control effort
| What you should do | Impact of not following | How to detect the issue | How to resolve the issue |
|---|---|---|---|
|
|
||
|
|
|
|
|
|
|
|
|
|
|
|
|
|
|
|
|
|
|
|